Real-Time Performance Monitoring Solutions

Your product relies on APIs and web pages - we'll tell you how they're performing and alert you when they fail.

Connected world requires detailed performance monitoring

Performance Monitoring

We've used our vast experience monitoring websites, applications, servers and network infrastructure to bring you the best features and functionality.

  • Checks performed from 12 global data centres for worldwide coverage
  • Over 10 million API and webpage tests run to date
  • Over 25 years experience in API, application and website performance monitoring

Professional API endpoint and webpage monitoring, uptime and performance statistics with tests from multiple global locations and comparison against our unique performance benchmark. Take control of your web presence with monitoring solutions from Monimetry.

Start Free Trial

Choose Monimetry as your API performance and monitoring solution partner

Today's application marketplace is highly competitive, and users are increasingly unwilling to tolerate slow and unreliable applications. An issue at an application's API layer can lead to users facing errors or latency, which can erode customer trust and negatively impact your business.

  • 01 Your application consumes third-party APIs

    If just one of those APIs fails or degrades in performance, your application suffers. See performance trends over time and get alerted to outages and issues as they happen. Look for changes in the HTTP status codes, or error responses from the target API and alert accordingly.

  • Your business depends on being able to serve customer requests quickly and without error. Get alerted to issues before your customers are impacted, reducing pressure on your service desk and keeping your customers happy.

  • It's common for organisations to use private APIs, application gateways or middleware to integrate applications and move datasets around the organisation. The uptime and performance of these APIs is critical to the running of your business. Use our trend analysis tools to monitor performance and receive alerts on error.


Global Reach for Targeted Results

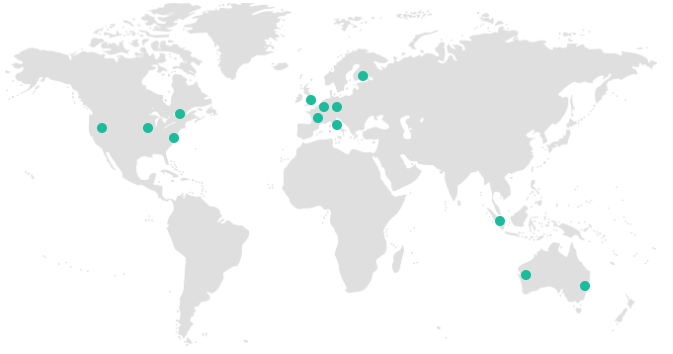
Our global network of checkpoints gives you worldwide coverage for more meaningful, targeted results, simulating your endpoint, application or customer locations.

US Flag

United States

French Flag

France

German Flag

Germany

British Flag

United Kingdom

Dutch Flag

Netherlands

Singaporean Flag

Singapore

Australian Flag

Australia

Canadian Flag

Canada

Italian Flag

Italy

Finnish Flag

Finland


Map of our global data centre locations

Features

All our accounts include in-depth checks based on HTTP status codes and the full API response, alerting you if unexpected changes are found. Run your tests from any combination of our 12 global data centres to match the geographic location of your endpoints, end users or application servers.

Detailed Page Tests

Alert on HTTP status code changes or specific strings in the content of your API response

Historical Data

Twelve months performance data to highlight trends and changes in your API performance over time

Global Coverage

Choose to run your tests from any combination of our 12 data centres to simulate real-world usage

Reduce False-Positives

By using multiple checkpoints in several geographic locations to mitigate against local issues

Key Metrics for Easy Troubleshooting

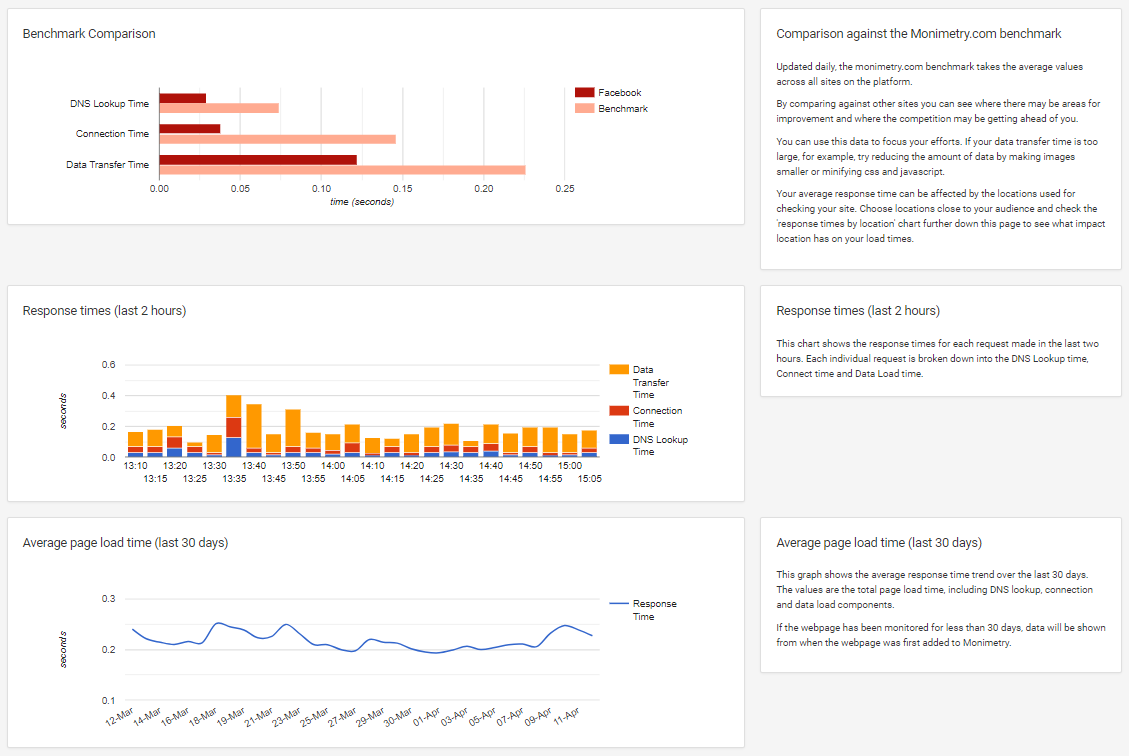
Breaking down your API performance into its constituent parts, highlights areas for improvement and our unique benchmark shows how you compare to the competition.

DNS Lookup Time 0.35s
Connection Time 0.08s
Data Transfer Time 0.2s
Total Page Load Time 0.65s

Alerting and Notifications

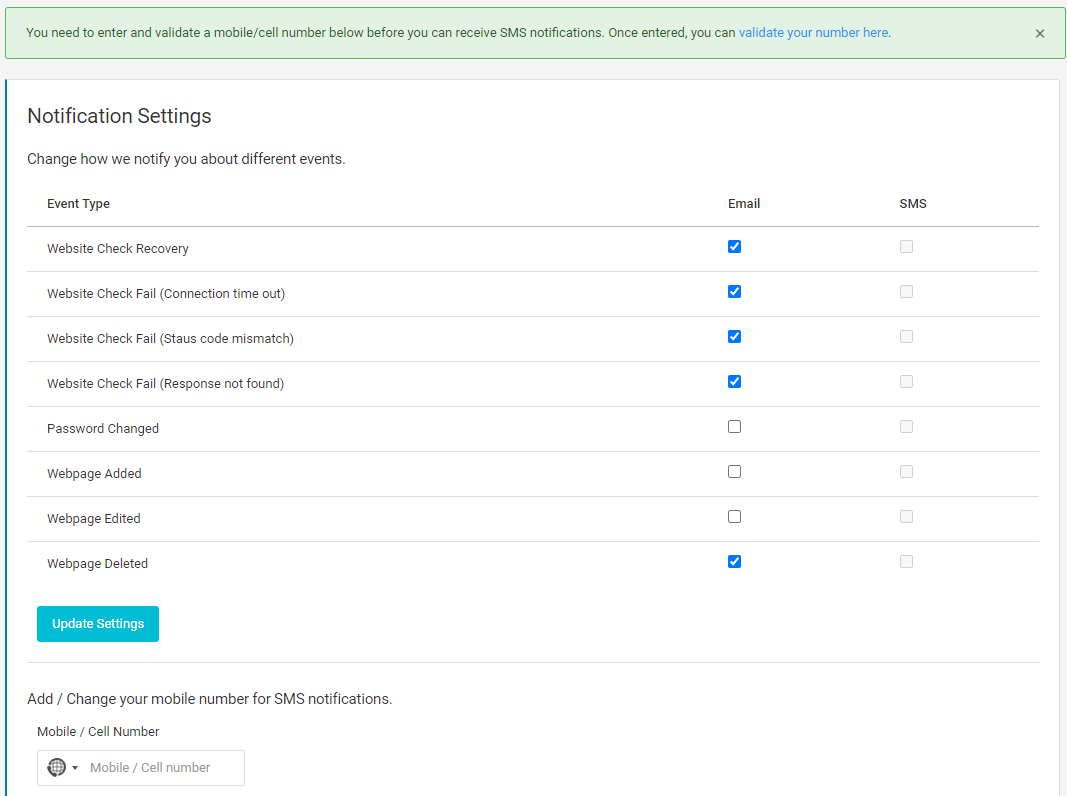
We can alert you when something changes on your web page or API, resulting in a change in response code, or the contents of the web page or API response. Alerts can be sent via email or SMS and we're working to add additional notification methods in the near future, including webhooks.

Connection Failure

Receive alerts if we receive a connection timeout from two consecutive checks from two different locations, reducing false positives.

Status Code Mismatch

Set the expected status code, so if you expect a 200 code and start receiving a 500 code, it shows your application is experiencing errors.

Response Mismatch

Each check reads the whole web page or API response and can look for specific text in that response. If we don't see that text, we can alert you so you can investigate.

Take a Look

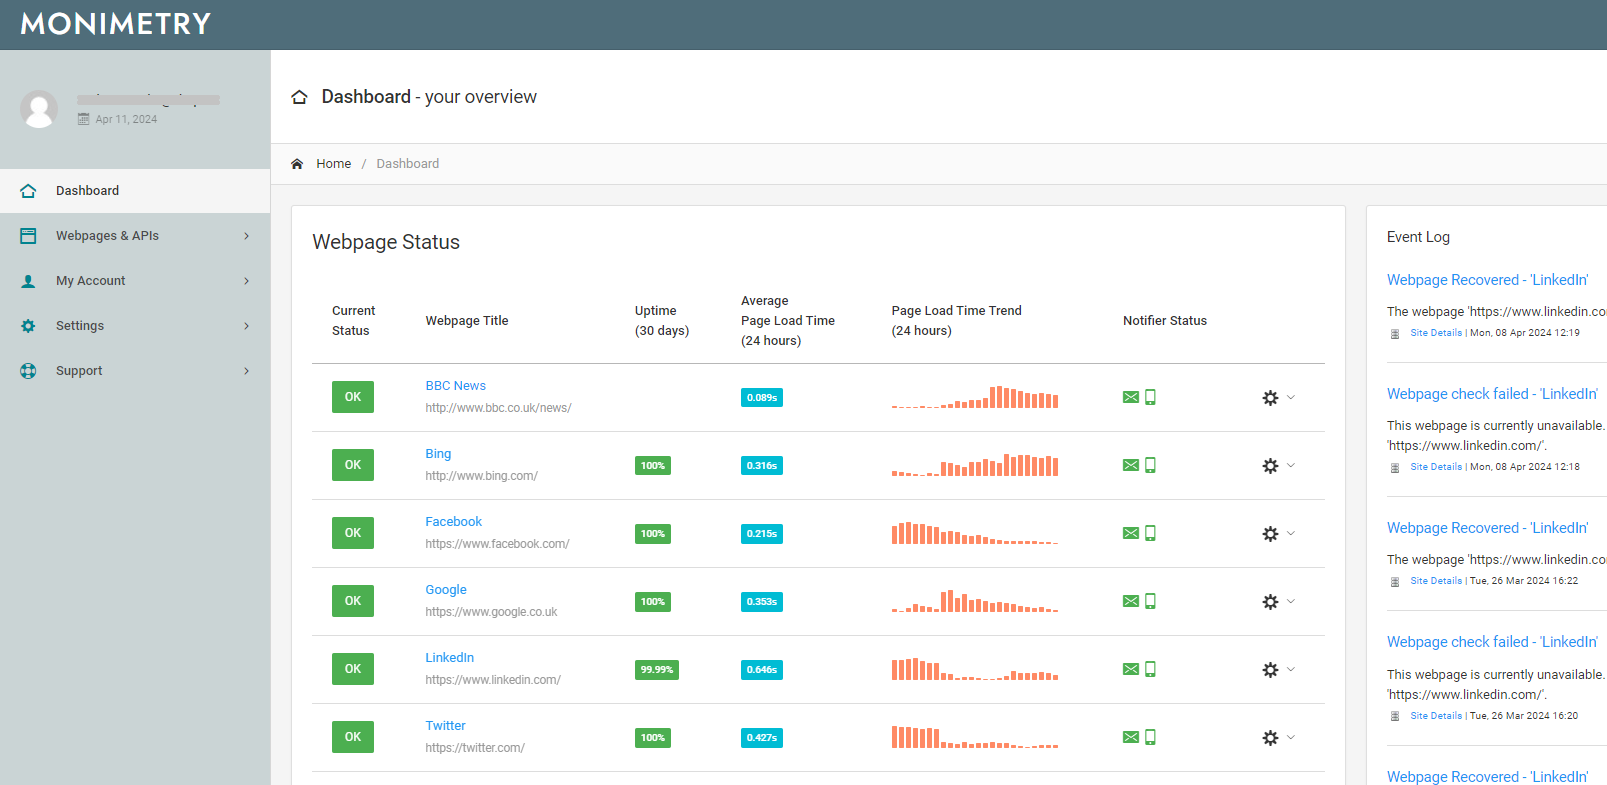
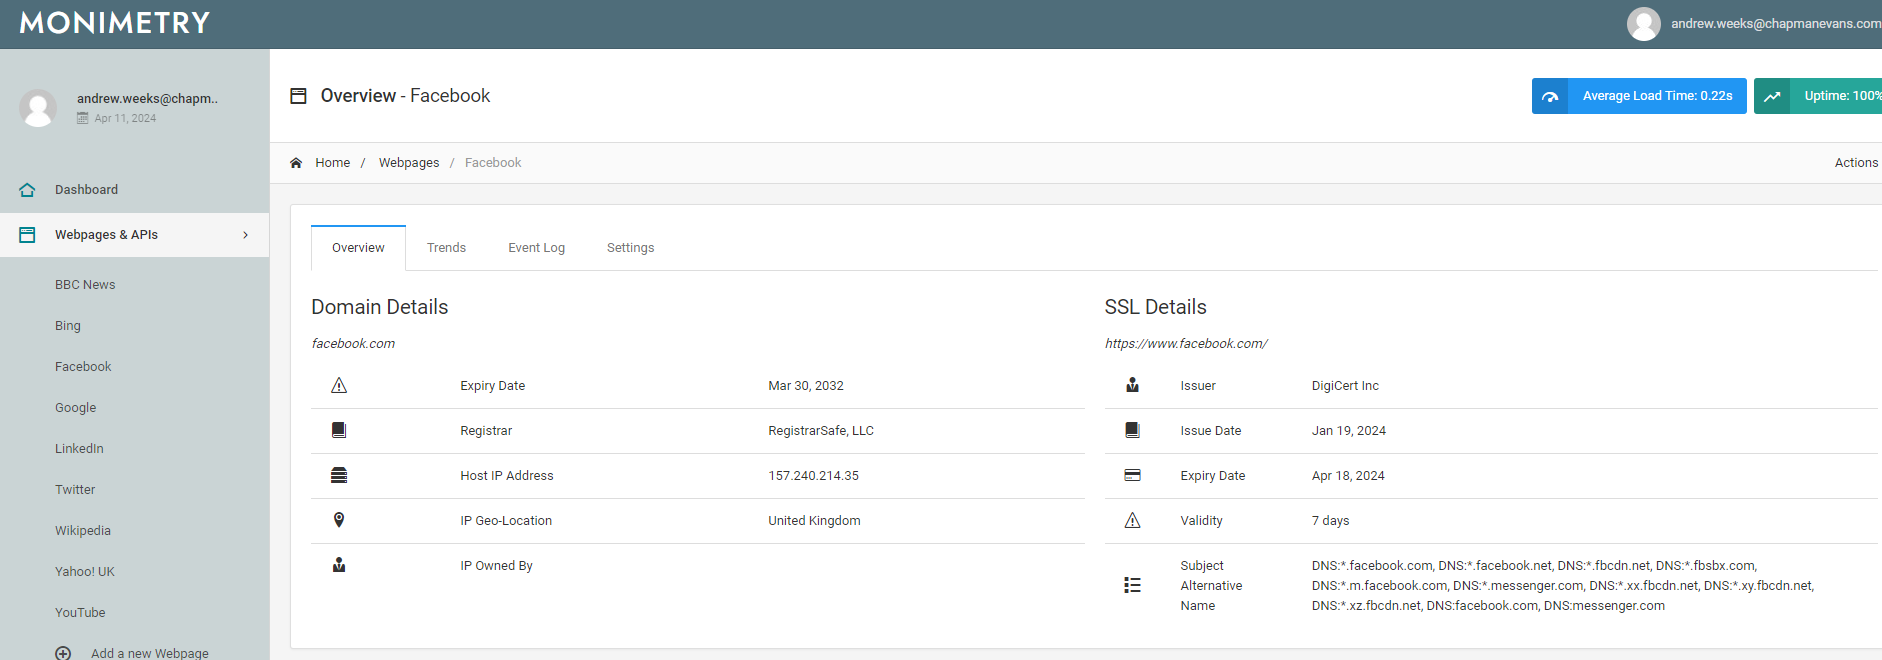
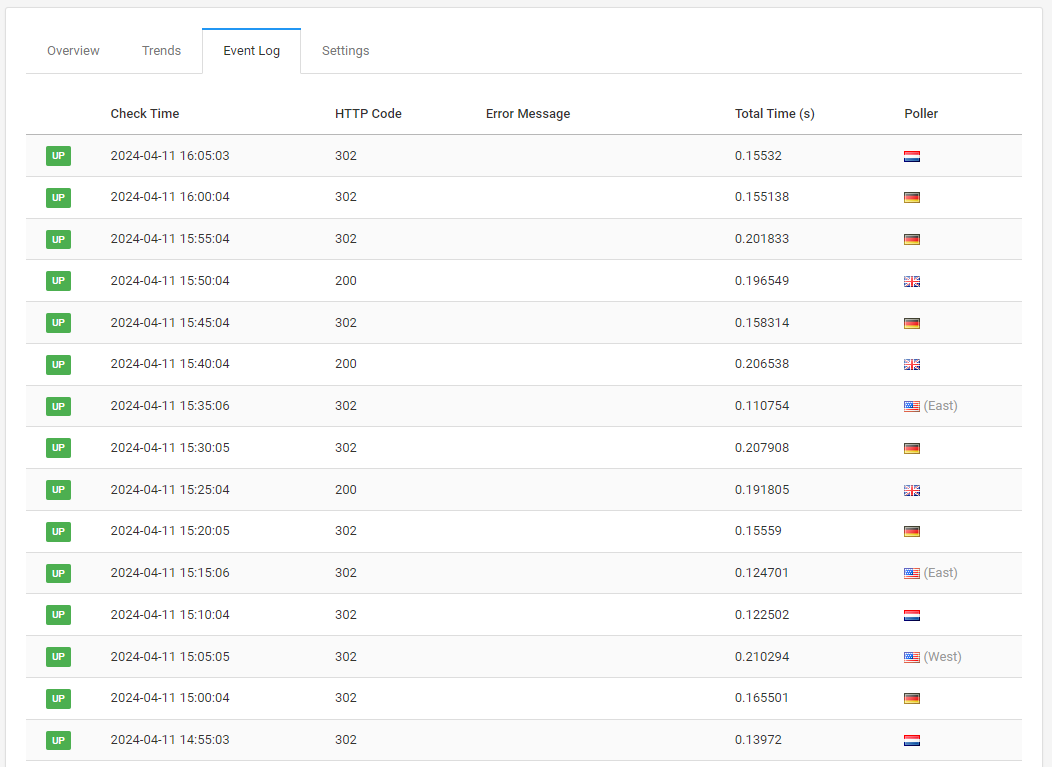
The screenshots below demonstrate some of the functionality in the Monimetry application. If you're keen to see more, sign up for our free 14 day trial and go for a test drive.

Dashboard

Domain Details

Event Log

Trends

Notification Settings

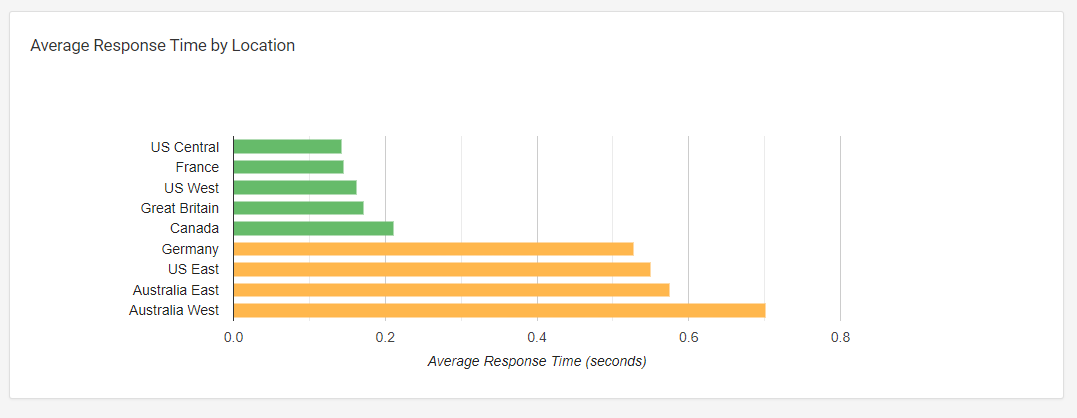
By Location

Certificate Status

Ready to See More?

Start a 14 day free trial and find out how your APIs are performing against the Monimetry benchmark. Gain performance insights and uptime alerts. Cancel at any time.

Pricing

No risk. No hidden fees. Cancel at any time. All accounts include the same great range of features - just choose how many APIs you want to monitor. Business and Enterprise plans include checks every minute - our professional plan checks your website every 5 minutes.

Professional Plan

£6(approx. $8 / €7) per month

  • 15 Concurrent Tests
  • 5 Minute Test Intervals
  • Test From All 12 Locations
  • SSL & Domain Expiry Notices
  • 10 SMS Alerts per Month
  • Unlimited Email Alerts
Free Trial

Enterprise Plan

£18(approx. $23 / €21) per month

  • 60 Concurrent Tests
  • 1 Minute Test Intervals
  • Test From All 12 Locations
  • SSL & Domain Expiry Notices
  • 40 SMS Alerts per Month
  • Unlimited Email Alerts
Free Trial

Frequently Asked Questions

We've answered a few of the most commonly asked questions below. If you need any further information, please get in touch.
To really find out how we work, take a 14 day free trial - cancel at any time.

  • What metrics do you monitor?

    For each monitored API or webpage, we report on the uptime and the average load time over the previous 12 months. Load time is broken down into DNS lookup time, Connection Time and Data Transfer time, so you can see which areas have the biggest impact on overall load time.

  • Our Professional account lets you monitor 15 API endpoints or web pages; our Business account lets you monitor 30 and our Enterprise account lets you monitor 60 web pages or endpoints. Get in touch if you require more than 60 web pages.

  • We take all the monitoring data we collect and produce an adjusted average for each of the metrics we present. By comparing your response times against our benchmark, you can see where there may be areas for improvement and where the competition may be getting ahead of you.

  • Yes - you can choose as many or as few of our twelve data centres to monitor from. We suggest choosing the ones closest to your target audience, so if your web pages are aimed at an audience in the USA, select the USA regions. Every time your web page is checked, a random data centre from your selection will be used so a picture of performance over the selected geography is quickly built up.

  • All our accounts start with a 14-day free trial. After 14 days, you will automatically be billed unless you cancel within the 14 day trial period.